
Q Calculator
Professional Parametric EQ Tool for Car Audio Systems
Your Filter Response Curve
Enter frequencies below to see how your EQ filter will respond
Enter your frequencies below to visualize your filter curve
Hz
Frequency must be between 20-20000 Hz
Hz
Center must be between lower and upper frequencies
Hz
Frequency must be between 20-20000 Hz
Calculated Results
Bandwidth
—
Q Value
—
Enter frequencies above to calculate Q value and see your filter curve
How to Find Frequencies in REW:
1. Switch to 1/12 octave mode for maximum resolution
2. Click on peak/dip to identify the center frequency
3. Note the level at center (example: 87 dB)
4. Move cursor left/right to find where level drops 3 dB (example: 84 dB)
5. Enter all three frequencies into calculator above
Quick Reference Guide
| Problem Type | Recommended Q Range |
|---|---|
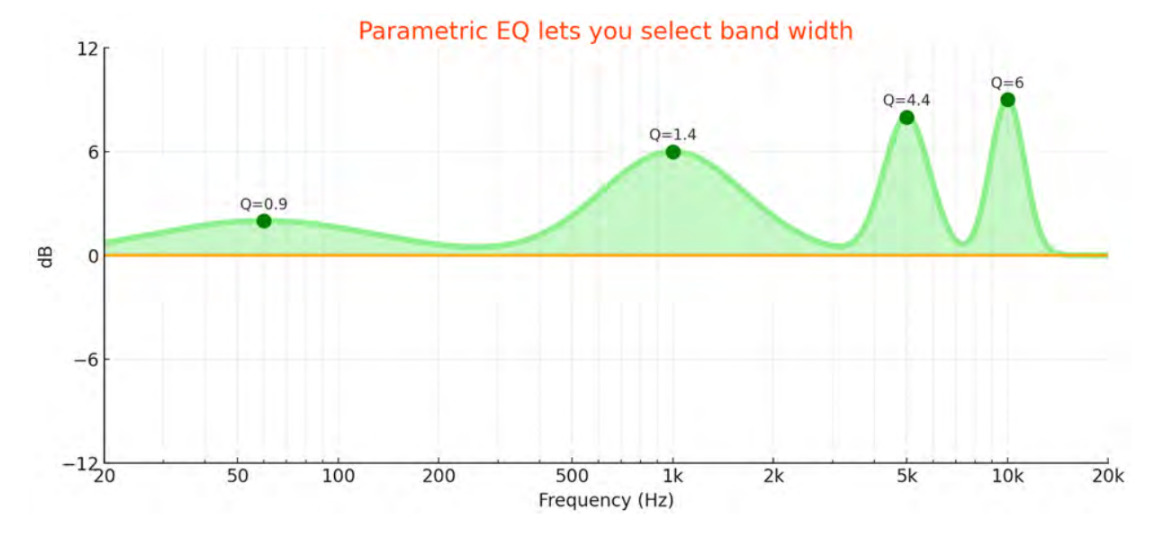
| Wide hump (2+ octaves) | 0.7 - 1.2 |
| Moderate peak (1 octave) | 1.5 - 2.5 |
| Sharp resonance (narrow spike) | 5.0 - 10.0 |
| Gentle shelf (highs/lows) | 0.5 - 1.0 |
| Crossover interaction dip | 2.0 - 4.0 |
RELIABLE PRODUCT MARKETING